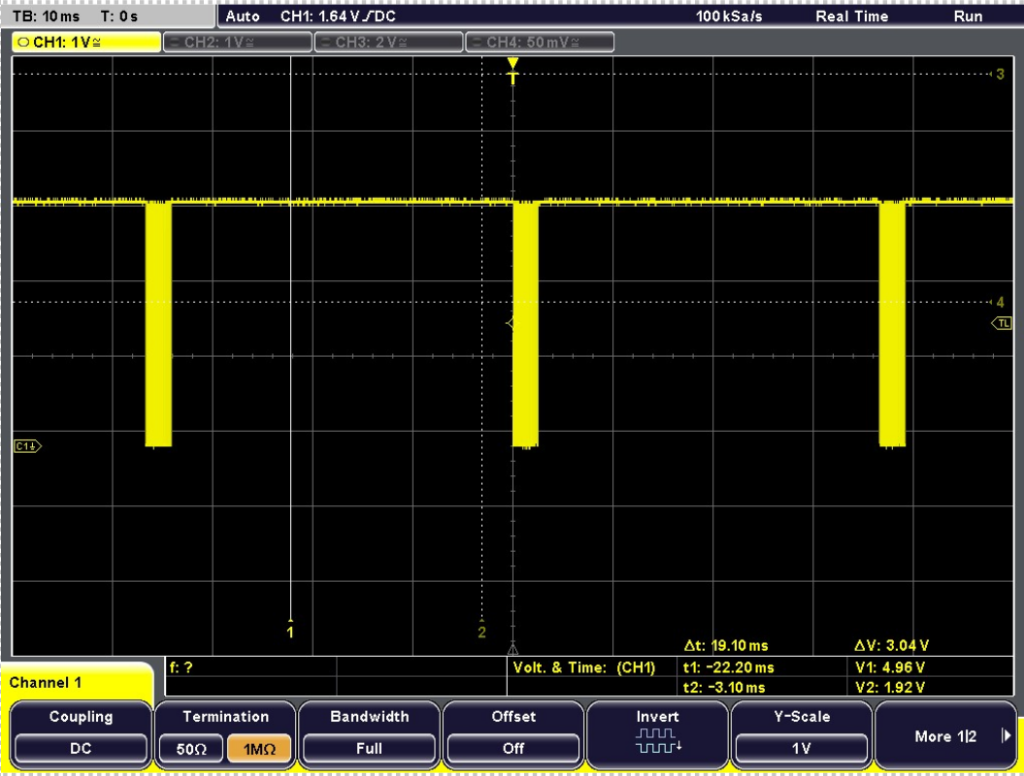
Micromouse point A.
This figure shows the output, of the first gate at 20Khz. Which produces a square waveform. We placed the probe at the logic out of the logical gate. We measured the output of the logical port with a 100nF capacitor.
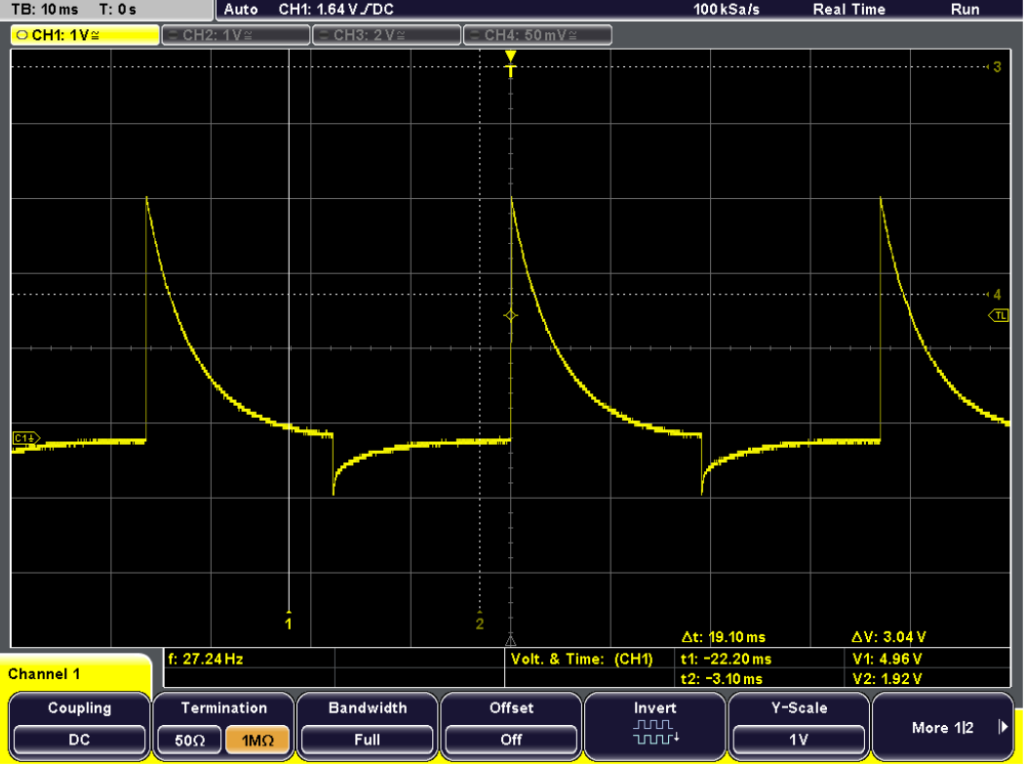
Micromouse point B.
This is the output signal at Point B. The probe is placed after the 100nF capacitor. The capacitor is charging and discharging as we can see in the figure. This proves that our circuit is working with the capacitor charging and discharging to fill the waves in the circuit.
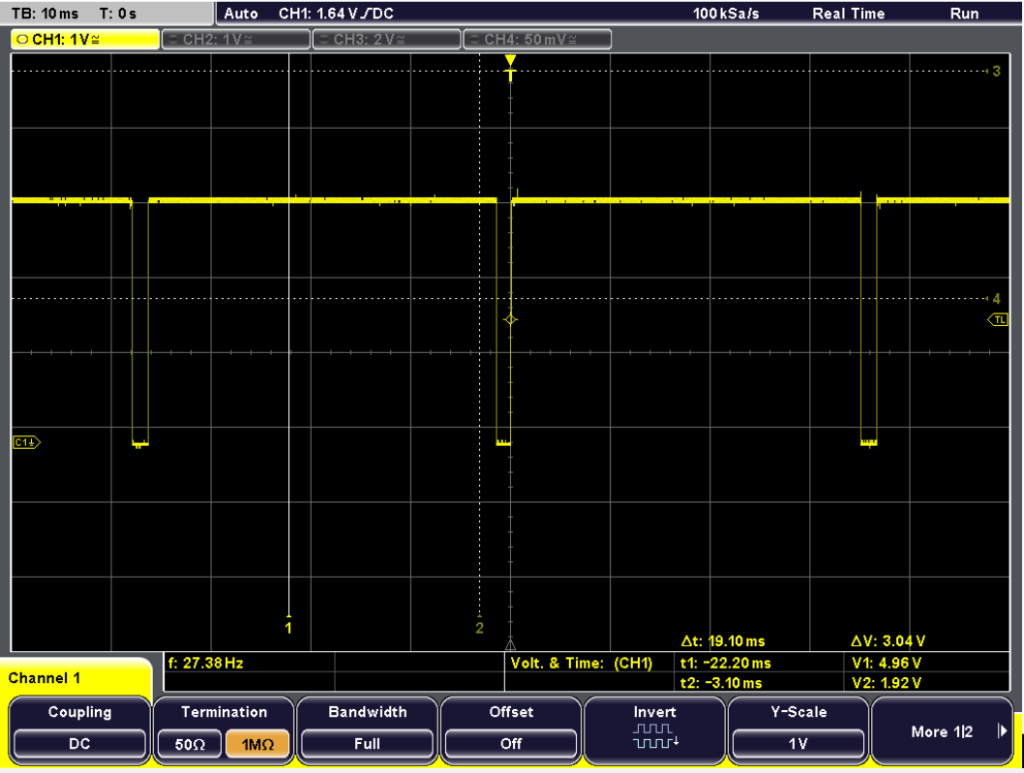
Micromouse point C.
This Figure shows a 40KHz burst square wave at point C. On the oscilloscope, we can see that the LEDs are being controlled by the transistor.
Micromouse point D.
Point D, the probe is placed at the output of the sensor. This is a logical controlled sensor which is used on/off or 1 and 0. This shows us that when the sensor is triggered (obstacle) the LED will show a low or high value (1 or 0).
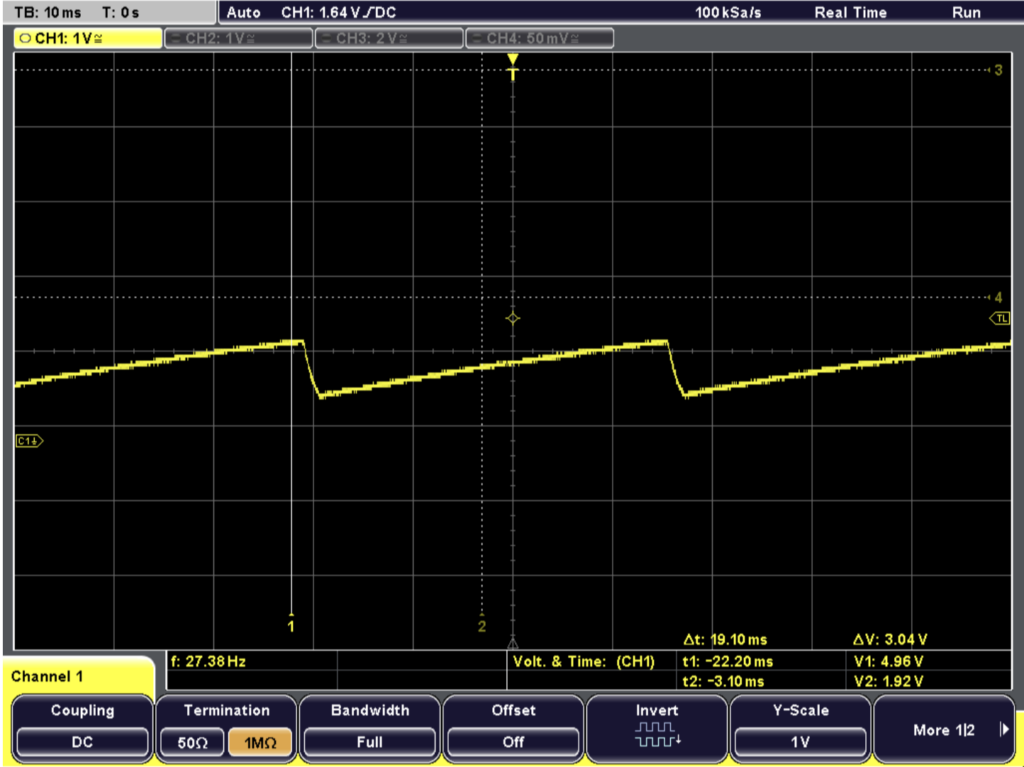
Micromouse point E.
This is the threshold voltage for detection. Measured between the input of the logical component and capacitor and resistor in a parallel connection. The threshold voltage is what we can see here is the transition from one state to another.